Ulli's Python Kurs
pyplot
from matplotlib.pyplot import *import matplotlib.pyplot as pltfrom matplotlib.pyplot import *
#Listen x und y erzeugen
x = list(range(-10,11,1))
print(x)
y = []
for i in x:
y.append(i*i) #y=x² (Parabel)
print(y)
#xy-Diagramm plotten
plot(x, y)
show()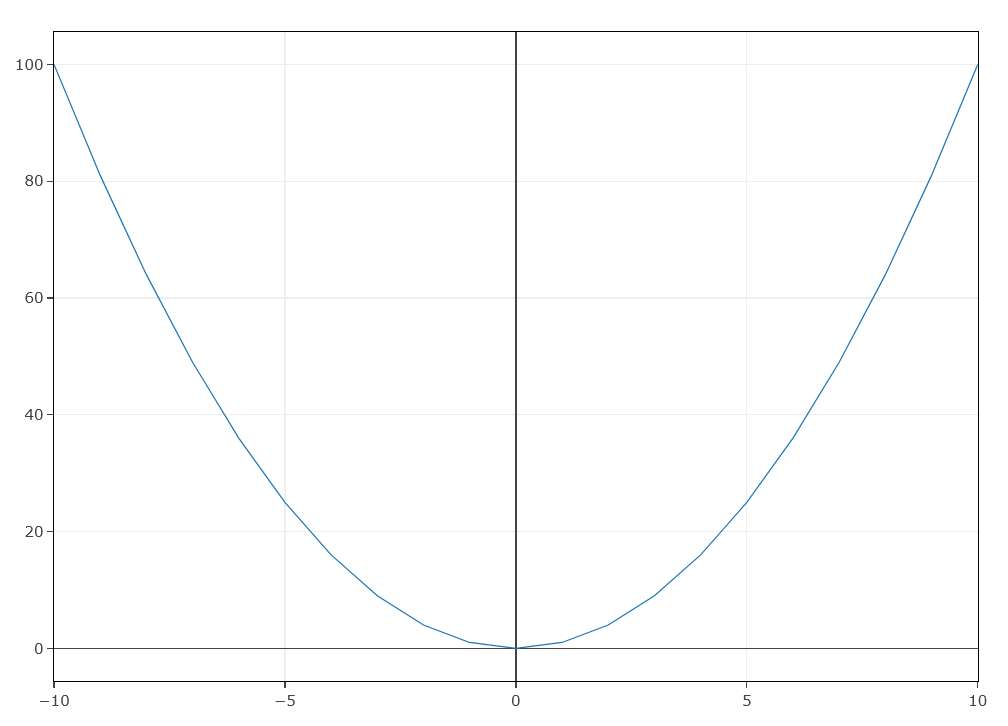
Wichtig: am Schluss werden die fertigen Diagramme mit show() angezeigt
from numpy import *
#Listen x und y erzeugen
x = arange(-10, 11, 1)
print(x)
y = x*x
print(y)